Teacher Stuff: assessment

Showing posts with label assessment. Show all posts

Classroom Digital Data Tracker Shortcuts in Google Sheets


As a teacher, if I got to pick a super power, I'd have to go with freezing time. Remember those shows from the 80s where a witch could blink or put her two fingers together and freeze time? If I could do that, I'd have more time to grade papers, create lesson plans, workout, or sleep! While I don't yet know how to give myself super powers, I do know how to give you a little bit more time––every teacher's dream!


It's important to collect a lot of data about our students, but trying to sift through it all can be a lot. Here are some shortcuts I learned using google sheets as a digital data tracker to cut down on the time I spend sorting data so I can spend that time analyzing it instead. It makes report card time SO much easier too!  


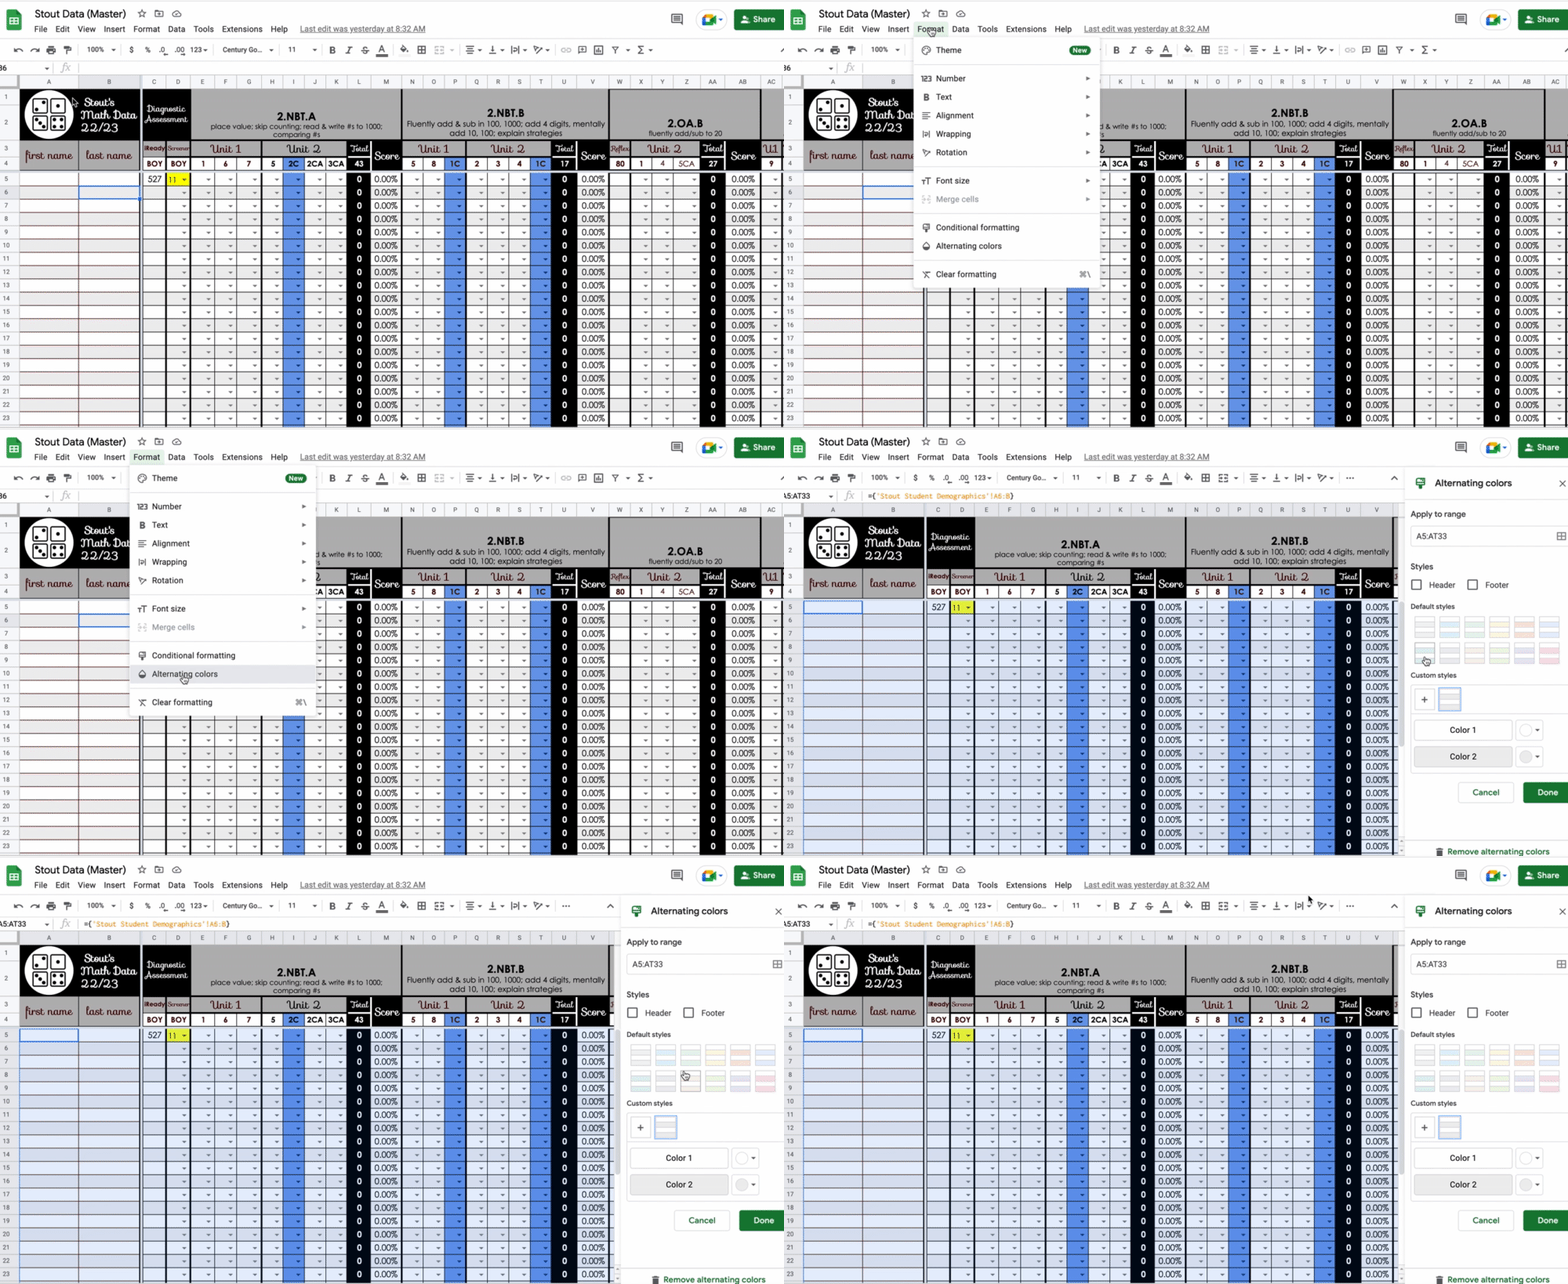
1. Alternating Colors: 

Format––alternating colors

Image from Gyazo

Okay, this is a really simple no-brainer that has been done since the beginning of teaching time, but it really does help! Google Sheets will make every other row an alternating color so it's easier to follow one line across the row. Just go to Format ––alternating colors. You can even pick different color combinations or customize your own. Freezing rows that need to stay in the same place can help with following the line across the row or column too. Check out my post Create Your Own Auto-Filling Data Spreadsheet With These 4 Tips for directions on how to do this. 


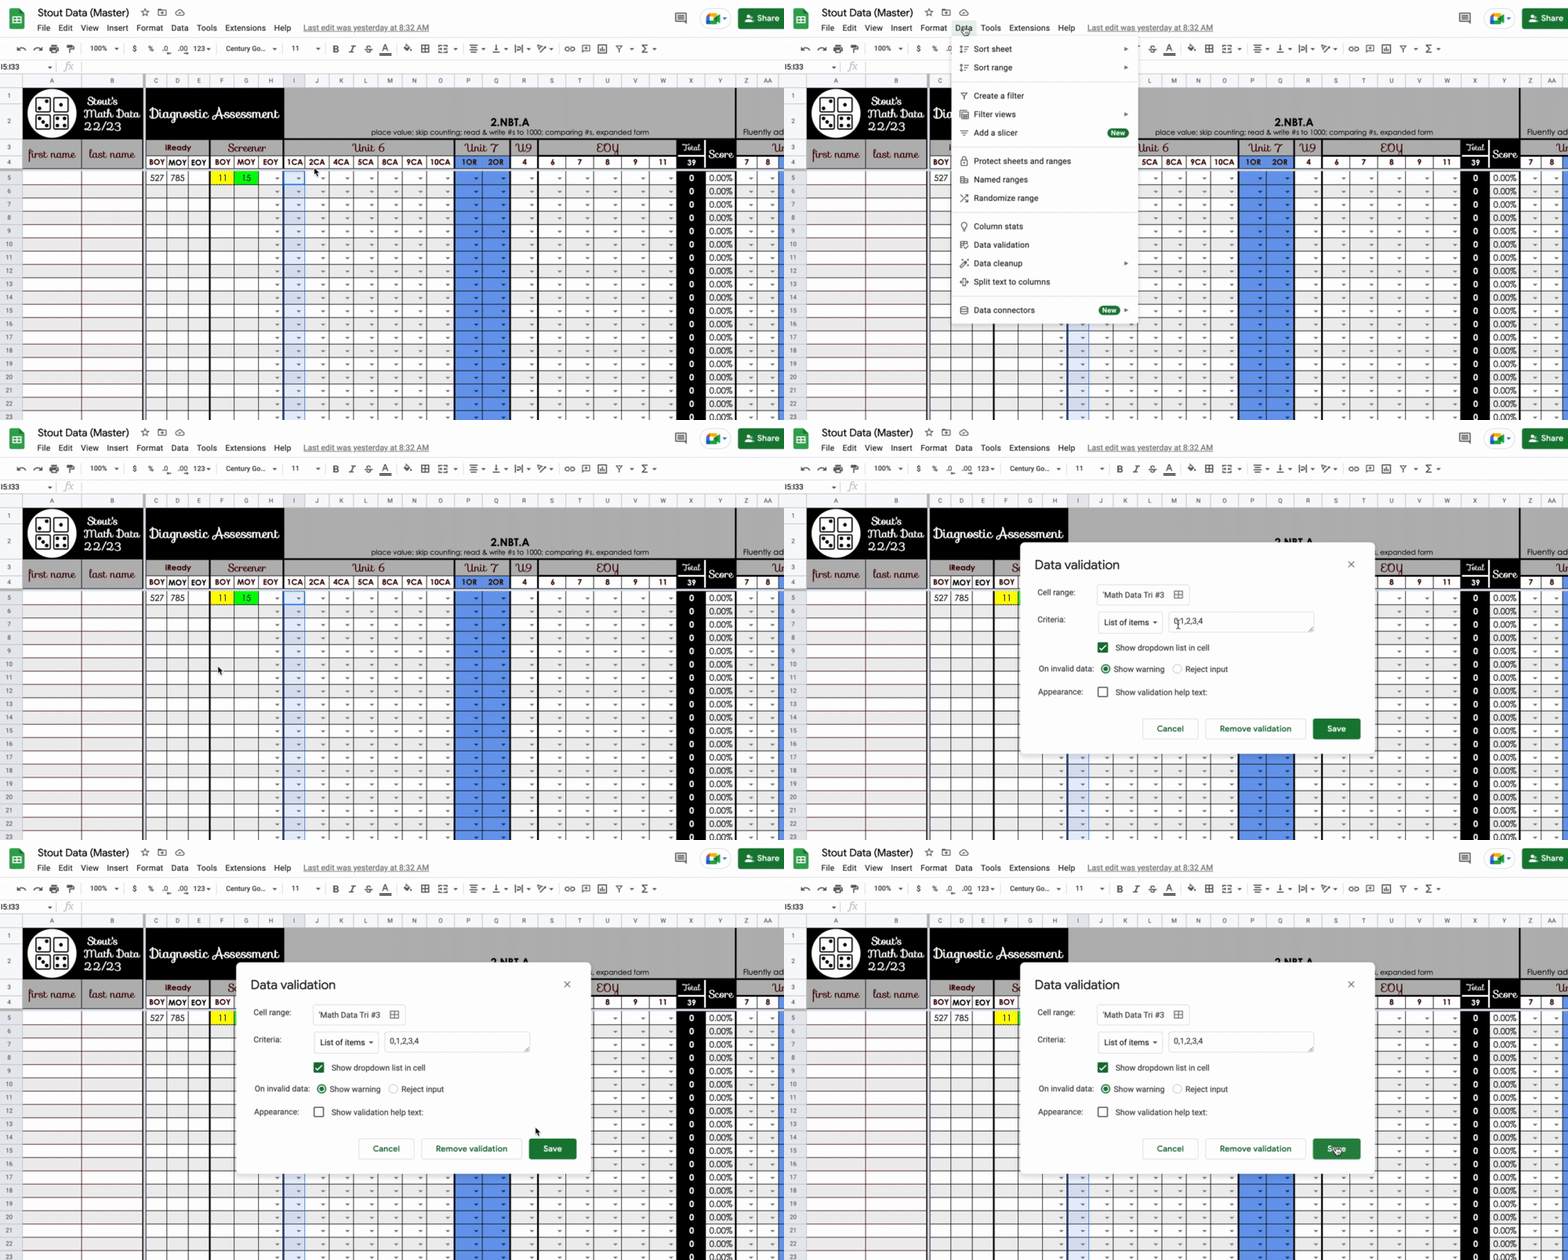
2. Drop Down Menus: 

Data––data validation––list of items

Image from Gyazo

This shortcut became a time saver for me because I am assigning a different value or weight to different test questions within a single test. The math program we use at my school tests a bunch of different standards on one test––not just one strand at a time. I have to figure out which standard correlates to each individual problem on the test and record them under a separate standard in my grade book (rather than one score for the whole test). So problem #1 which tests standard 2.NBT.1, for example, might have 3 parts (a, b, c), so I want it to be worth 3 points. But problem #2, which tests 2.OA.2, might only be worth 1 point. Using a drop down menu helps me remember how heavily I weighted each test question when I'm recording the grade so I stay consistent. To make a drop down menu, highlight the whole column, and go to Data––data validation––list of items. I always use 'list of items' and then list the numbers possible separating them with a comma like this: 1, 2, 3. I like it because it puts the number choices in the drop down menu for you to choose. Then click on the arrow to choose one of those numbers.


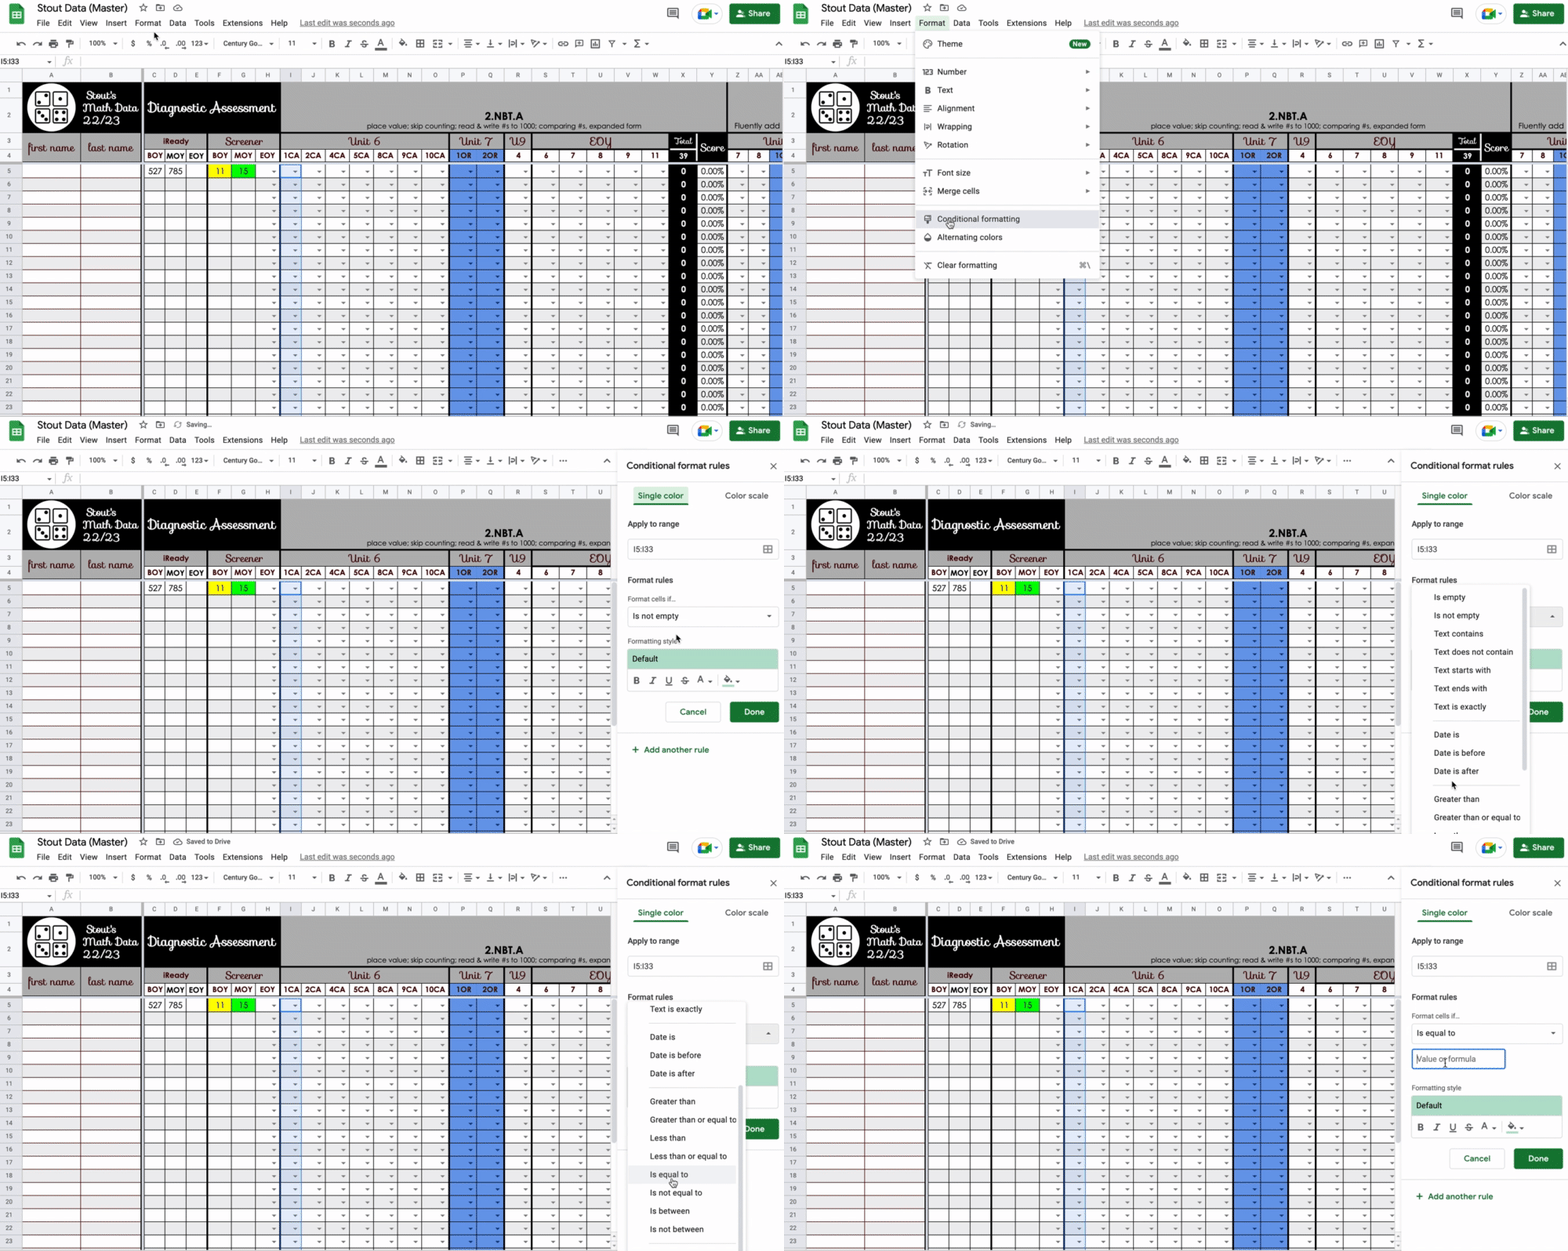
3. Color Code the Data
Format––conditional formatting–format rules–"is equal to"–change the default color with the paint bucket

Image from Gyazo 

This shortcut has made the biggest difference for me! I like to see a data page color coded so I can get a sense of whether a student (or my whole class) is passing a standard at a glance. For example, if I have a problem worth 3 points, I can make 1 out of 3 points unsatisfactory and color code it red; 2 out of 3 points would be partially proficient and I would color it yellow; and 3 out of 3 points would be proficient and I would color it green. Then at a glance I can see if a lot of kids missed a certain question by the colors I see going down that column. I was color coding my data before, but I would highlight and change the color in each individual box. Conditional formatting has revolutionized my data analysis! I can set a whole column at one time to change the color of the box when I put the score in. Just highlight the column or row that you want to color code using the same data parameters. Go to Format––conditional formatting–format rules–"is equal to"–change the default color with the paint bucket. Now when you type in a number or choose a number from the drop down menu, it will automatically change the color based on the rules you set. 


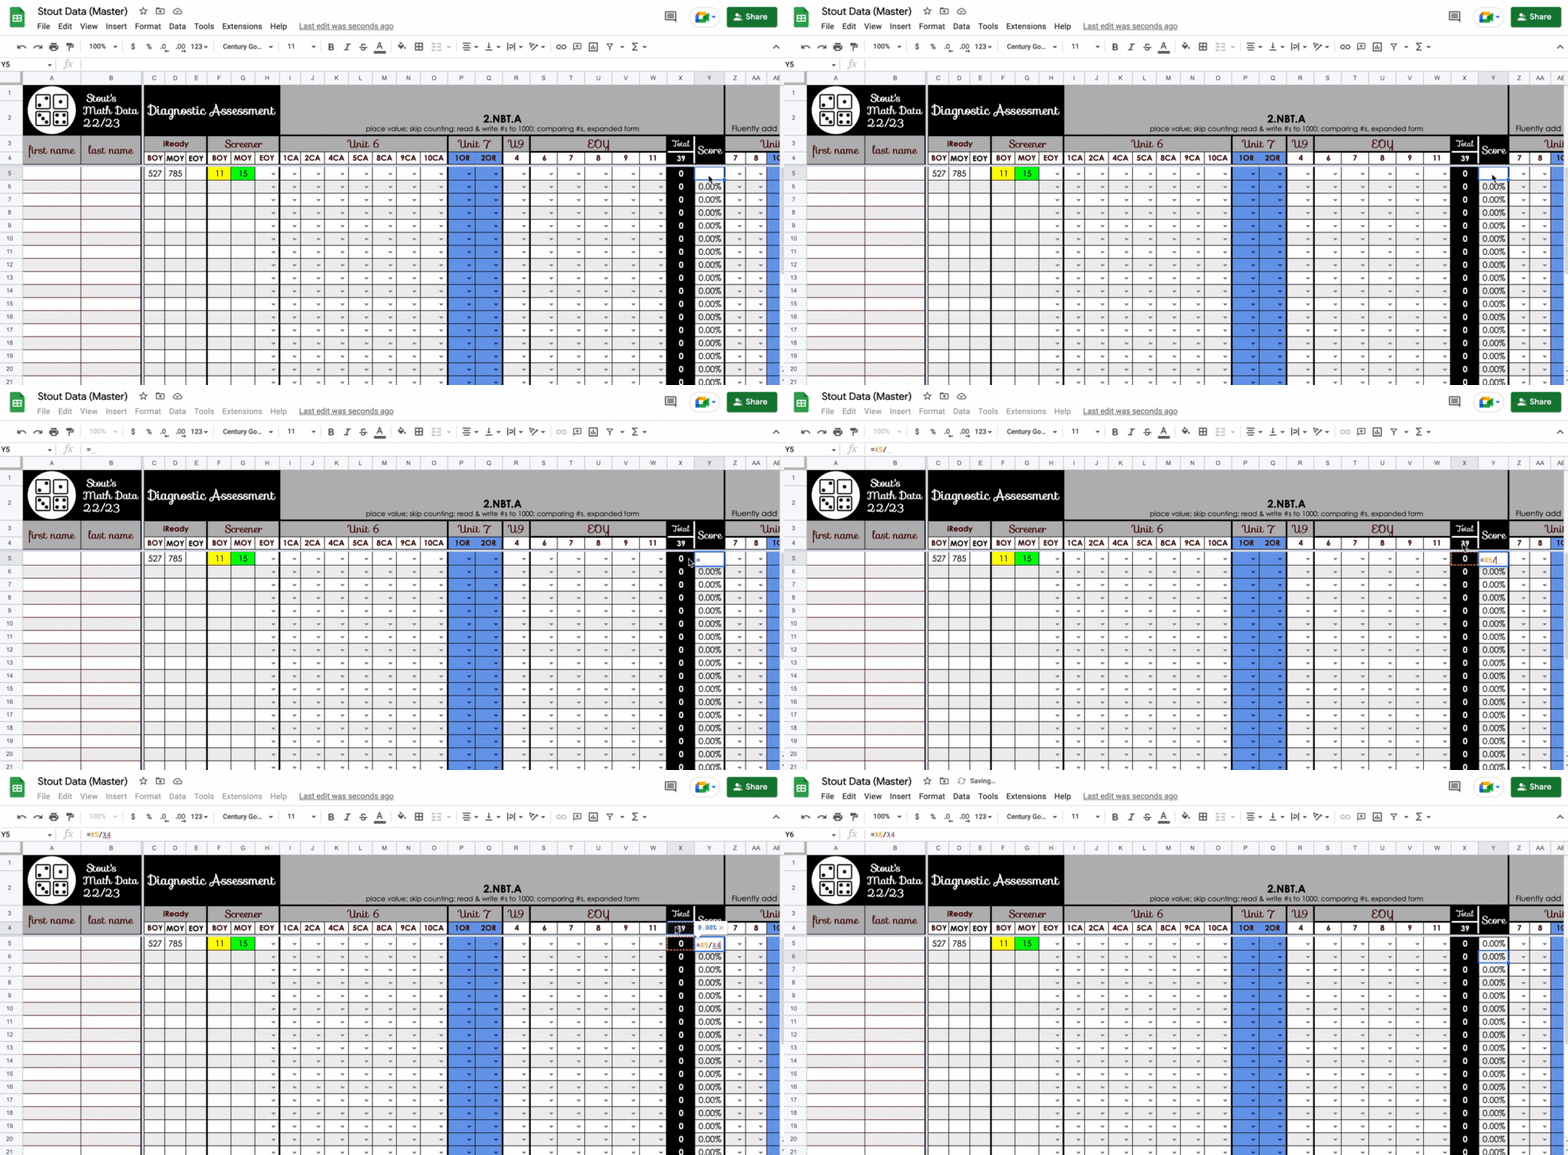
4. Average the Score:

=(click in the box of the student total)/(click in box of the total possible) 

Going back to my math test example, I have random test questions across several units that fall under one standard. We use standards-based grading, so I average all of those individual test questions over several different units to determine how the student is doing on that one standard. To do this, first I have a total column at the end of each standard, and I have the spreadsheet automatically add up the total number of points the student earned for that standard (see the blog post Create Your Own Auto-Filling Data Spreadsheet With These 4 Tips for directions on automatically adding totals). For example, if unit 6 had five test questions for standard 2.NBT.B, and unit 7 had four test questions for 2.NBT.B, I have a box at the top of the spreadsheet with the total number of points possible––in this example 24––and then the spreadsheet calculates the total number that student earned. In the "Score" column, I have the spreadsheet average the score and turn it into a percent. To do this, click in the "Score" box for the first student and type =. Then click on that student's "total" box and it will add it to the formula. Next hit the / (which means divided by) and click on the box that has the total number of points possible. My formula for this example looks like this: =X5/X4


Image from Gyazo

To make sure the score is shown as a percentage, highlight the whole score column and click on the picture of the % on the toolbar across the top. Now at a glance you can see which students are passing the standard over time.

I also have a blog post that I published a few years ago called Create Your Own Auto-Filling Data Spreadsheet With These 4 Tips. It shows you how to freeze rows and columns, automatically add totals, automatically populate data on a shared page, and create pivot tables to analyze data. You should check it out for ways to make your data tracker even more legit.

I hope you find these tips helpful in saving you time during your data collecting! 


0

How Fast Should a Student Be Able to Type?


 How fast should students be able to type? 

There is no universal answer to this question, but it is a question that we have to start addressing in elementary school. We don't want keyboarding fluency to get in the way of students sharing what they know. We want them to have transcription efficiency with keyboarding so working memory and cognitive resources are freed up for ideas. This is especially important when they are taking a test on the computer. In my district, every student beginning in kindergarten has to take a test on the computer within the first 30 days of school to determine if they need to be put on a READ plan. But then we have to wonder; are we putting some students on a READ plan simply because they don't know how to type/navigate a computer? The high stakes testing that begins in 3rd grade is also done on the computer, so keyboarding fluency is an issue that we have to start addressing in elementary school.

Unfortunately, there is no exact word-per-minute count that everyone agrees upon. Most keyboarding research is focused on middle school, and it's more than 10 years old. Technology has changed a lot in the last 10 years! If you check the Common Core State Standards, the expectation for typing begins in 4th grade, but there is no exact number attached to it:

CCSS.ELA-LITERACY.W.4.6
With some guidance and support from adults, use technology, including the Internet, to produce and publish writing as well as to interact and collaborate with others; demonstrate sufficient command of keyboarding skills to type a minimum of one page in a single sitting.

The CCSS do not become more specific for older students. Here is the standard for 11th - 12th grade:

CCSS.ELA-LITERACY.W.11-12.6
Use technology, including the Internet, to produce, publish, and update individual or shared writing products in response to ongoing feedback, including new arguments or information.

So how do we know if our students are college and career ready with the fundamental concepts of technology operations and troubleshooting skills they will need to be successful? 

That's a tough question to answer.  It's a question that we have been wrestling with at my school for years, so we decided to do our own action research. We started with the end in mind. We began with this question:

How fast should an adult be able to type? 

If you check the internet you'll see claims that the average typing speed for an adult is anywhere between 40 - 65 wpm. I did find some recent research called Observations on Typing from 136 Million Keystrokes that states, "Typing speed of an average professional typist is usually from 50 to 90 wpm, and some advanced typists work at speeds above 120 wpm." 

If we want our high school graduates to be equipped for a job as a typing professional, they should be able to type at least 50 - 60 wpm with 80% accuracy or better, so we made that our goal for a 12th grader. We worked backwards from there creating a reasonable expectation for each grade level, then we monitored our students to see if this fit our expectation for students in the classroom. We are continuing to monitor our students keyboarding progress, but so far, the rate on this chart seems like a good measure of their success. 

Testing season is upon us, and we monitoring whether or not we think our students are ready for that high stakes test online. Based on our action research so far, we found that if 3rd graders' typing fluency is at least 10 wpm with 80% accuracy or better by March/April, they're going to be in a good place to focus on the content of the test, and not the typing. The same has been true for 4th grade (15 wpm with at least 80% accuracy) and 5th grade (20 wpm with at least 80% accuracy). 

The reason I shared this process of identifying typing speed with you is because THESE NUMBERS ARE NOT AN OFFICIAL KEYBOARDING FLUENCY RATE. There is no official keyboarding fluency rate at this time, but this is a reasonable guideline based on what we know and what we see in the classroom. I created the keyboarding fluency infographic, graph, and SMART goal page that you can download here on Teacher Sherpa. I also like to use these pages in SeeSaw so students can upload their progress and record their goals.

How fast should students and adults be able to type in your experience? Do you know how fast you type? If you check out this research page, it has a place where you can take a test to see how fast you type! Observations on Typing from 136 Million Keystrokes Let us know your score!
4

Create Your Own Auto-filling Data Spreadsheet With These 4 Tips


This summer I became Level 1 and Level 2 Google Certified. Woot woot! I even got to visit the Google faciity in Boulder which was AMAZING! Some of the things that I learned make analyzing team data much easier. For example, the kindergarten team at my school assesses students with the Literacy Skills Assessment 3 times a year. They wanted an easy way to compile the data from all of their classes to analyze how all students in kindergarten are performing.

First, I created a google sheet that had a page for each individual teacher on the team and one page for the whole grade level called the Team Data Wall. 

1. Freeze Rows

Image from Gyazo
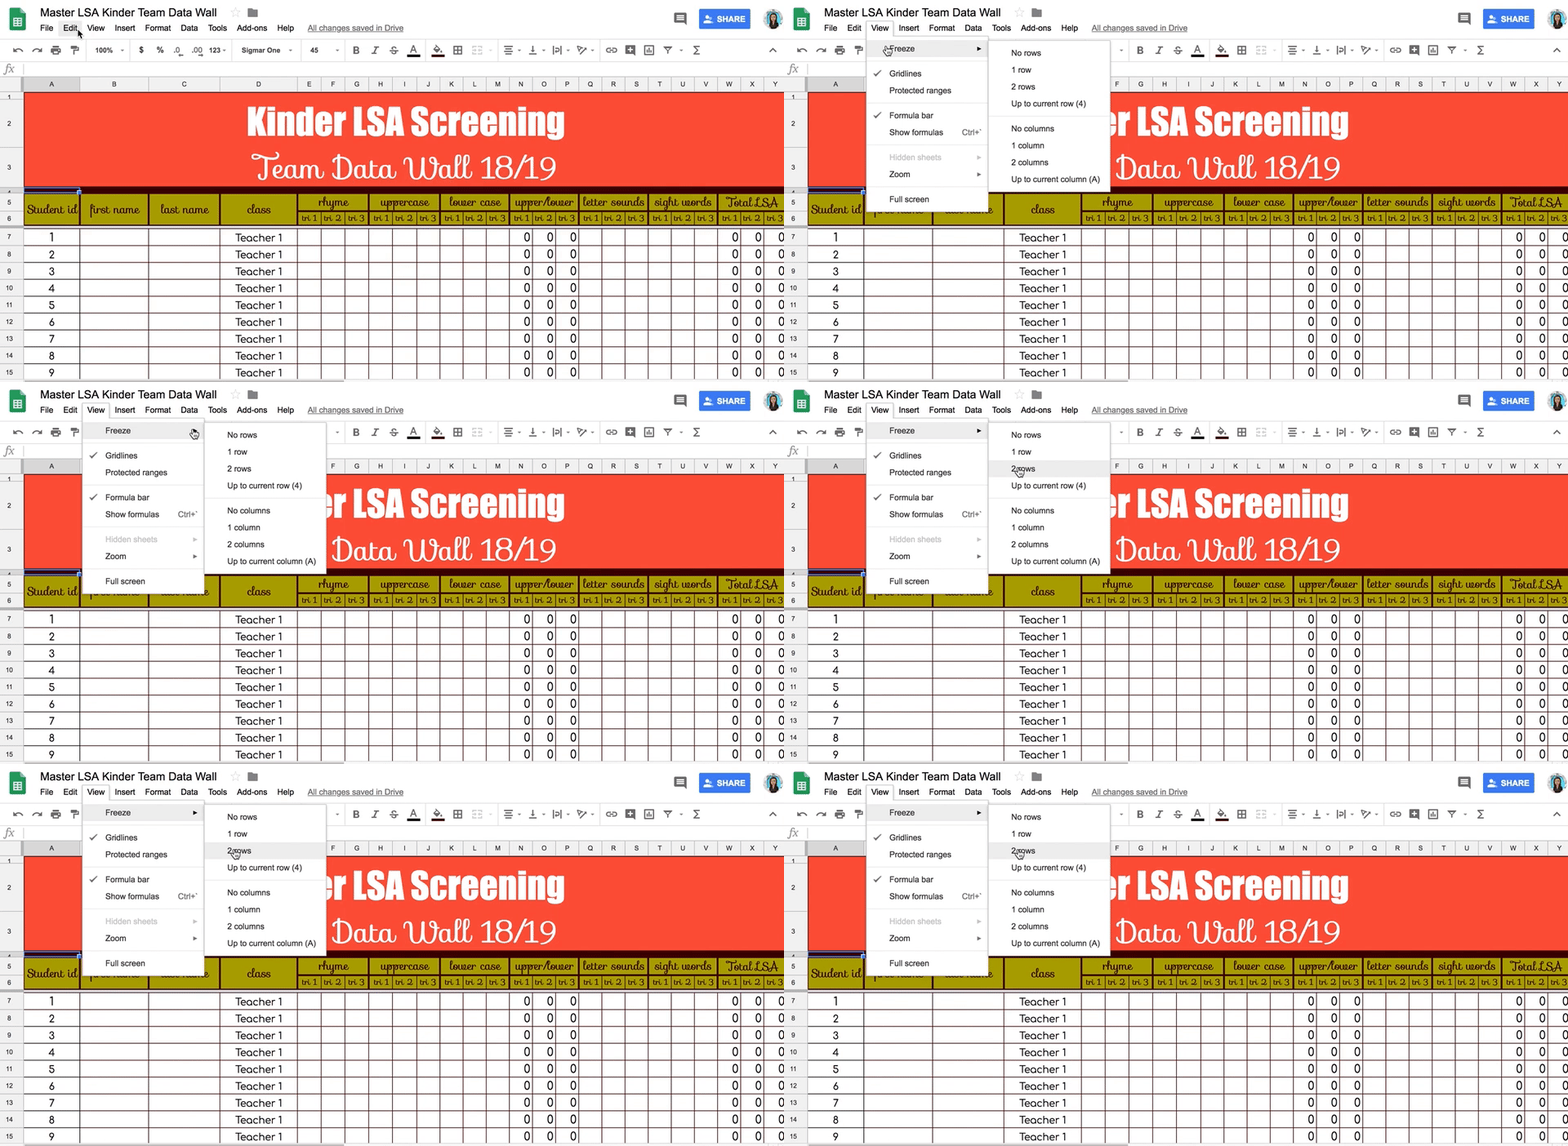
This is simple, but important! You want to freeze your headers or titles so that when you sort data, it doesn't move the headers into your data. Go to View–Freeze–2 rows. I needed more than 2 rows frozen because I have a big header. A line shows up to show you which rows are frozen. You can just grab the line and pull it down to freeze more rows. 

2. Automatically Add Totals

Image from Gyazo
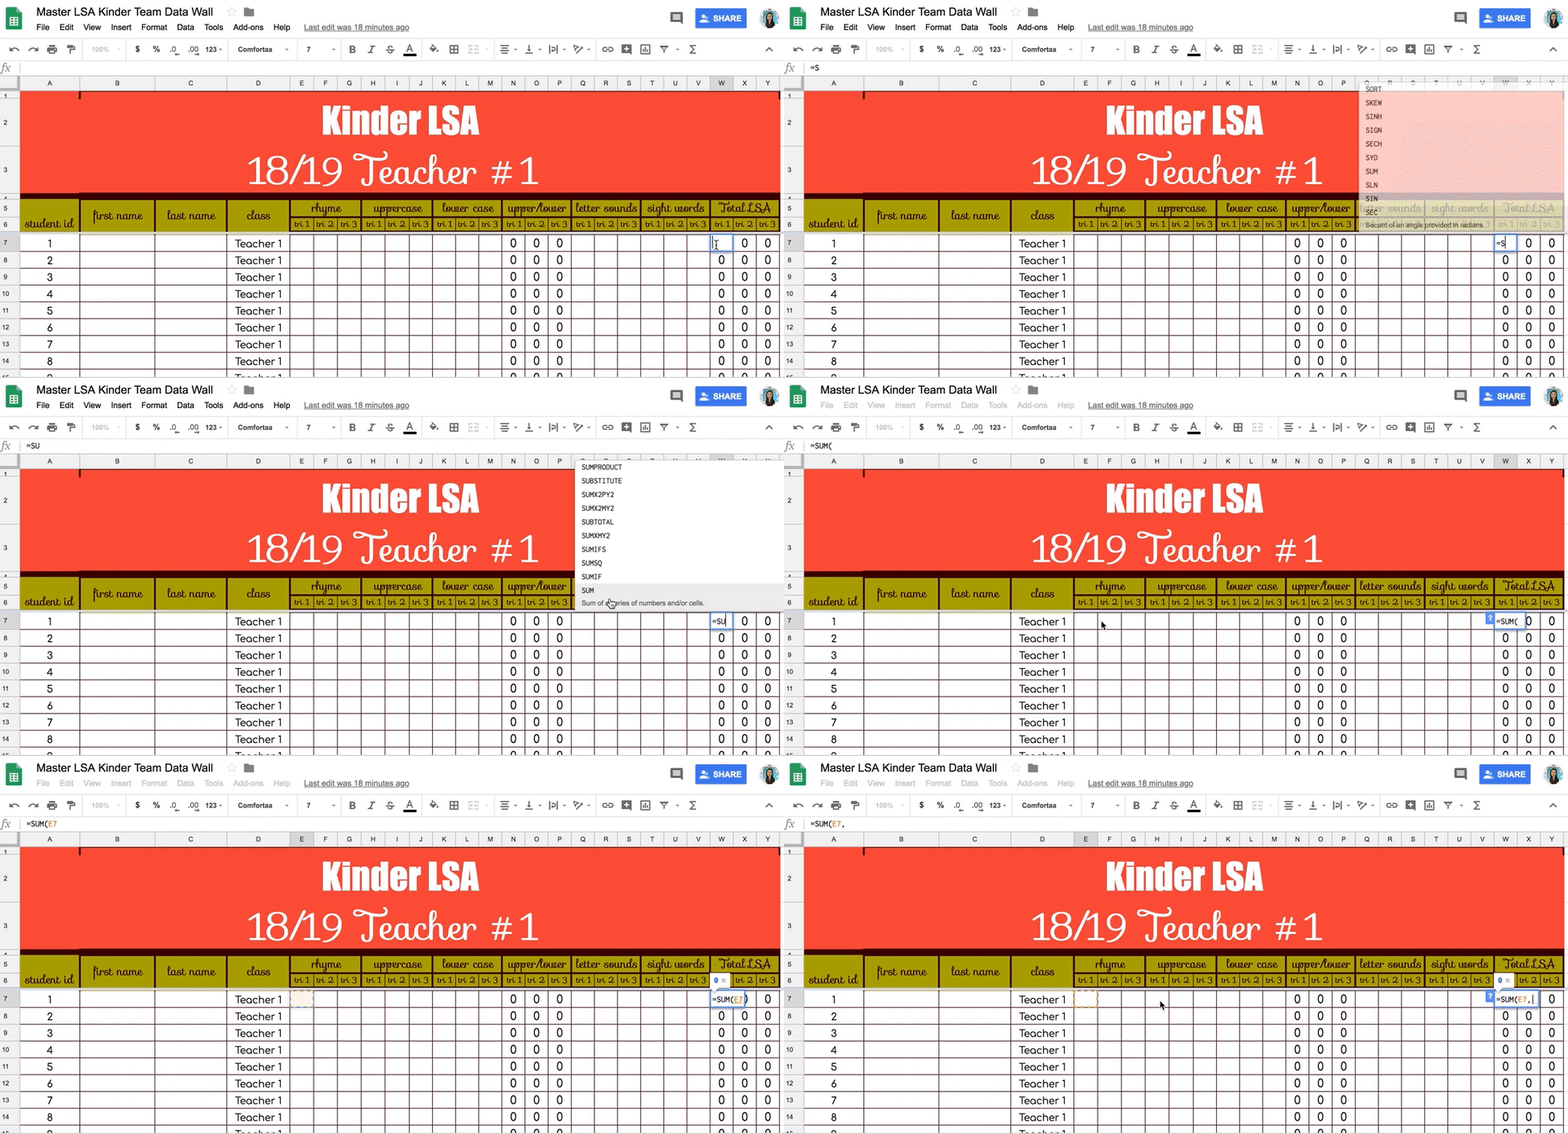
Another simple but time-saving trick is to make sure your spreadsheet does the math for you. On this google sheet, there is a column called upper/lower that calculates the total number of upper and lower case letters that the student knows. The total LSA score is all the data added together. These columns are set up to automatically add the total scores for each trimester. To do this, click in the box you want to calculate the total and type =SUM. Next, click in the boxes that you want added together with a comma between the numbers. My code in the example is =SUM(E7,N7,Q7,T7). Once you create the command for one box, you can copy and paste in another box. It will automatically adjust to fit the numbers in that row.

3. Automatically Populate Data on a Shared Page

This gets a little more sophisticated, but it's one of the features I'm most excited about! I found the video above which does a nice job walking you through each step of combining data onto a new page. The problem we had when analyzing this data before was that the teachers wanted to see their individual classroom data, but they also wanted to see the data as a whole grade level. That meant they were typing the info in more than one place, which was a waste of time. This feature let's teachers type in the names of students and data on their individual classroom page, and it automatically shows up on the Team Data Wall. This is the function I added to do this on my Team Data Wall: 
=QUERY({'Teacher #1'!A7:Y;'Teacher #2'!A7:Y;'Teacher #3'!A7:Y;'Teacher #4'!A7:Y;'Teacher #5'!A7:Y},"select * where Col1 is not null",0). 

The information from every classroom is automatically entered. Such a time-saver! The downside is that you cannot sort the data on the Team Data Wall itself. You can only sort it on the original page, but that is where pivot charts come in handy. 

4. Create Pivot Tables to Analyze the Data


Pivot tables let you analyze a large set of data in different ways. For example, this sample pivot table shows us column A is the number of rhyming words students knew, and you can see how many students in each class knew that number of rhyming words by following the columns across the top. Therefore, 2 students in Teacher 1's class and 2 students in Teacher 2's class knew 0 rhyming words.  It also gives a grand total of students in kindergarten that knew 0 rhyming words. Just move down the rows in column A and follow the data across to see how many students knew 1 - 10 rhyming words. These pivot tables do live updates, so as soon as the data changes, so does the chart. 

Creating pivot tables on my spreadsheet makes me feel like a real coder! It seems really fancy, and while this is the most difficult tip in this post, it is really not that hard to do once you get the hang of it.  The video above is a little long, but it shows you how to create different kinds of pivot tables in your google sheet. You really need to watch the video to understand the logistics of how to create and code your pivot table, but here is the data I used to create the example pivot table on rhyming words.


These tips can help you analyze your grade level data much more efficiently! You can also download a copy of my LSA Kinder Team Data Wall here on Teacher Sherpa if you don't want to make your own. Happy analyzing!


0

CCSS Writing Rubrics K - 5

There are many layers to writing. Students have to come up with a good idea, develop it, develop the characters, organize it, not to mention spelling, grammar, and punctuation. All of these writing elements are outlined in the Common Core State Standards, but keeping a record of it all can be overwhelming if you don't have a way to organize it, so I've organized the writing standards and 2 language standards that can be used as a rubric, or just a checklist for a body of evidence. 
There are 3 or 4 writing genres each K - 5, which are color-coded on the rubric. This is an example of the 3rd grade rubric. You can choose a genre of writing to grade and you can even grade that piece of writing on language standards 1 and 2.
Here is an example of a piece of narrative writing that I graded.  I scored the narrative elements on a 4 point rubric. If you follow the red color down to the grammar and usage section, I checked off the language & production elements that I saw in this story (I left the name off of the paper for confidentiality). If the language or production standard was not present at all, I left it blank. If there were mistakes, I gave it a minus or check-minus. Then I made notes on the back:

Now I can address the specific issues that this student struggled with, such as capitalizing the "i" or using apostrophe's in contractions, so that I can see if it improves over time and transfers to other genres. This form can be used as a rubric and it also helps me document all of the elements of opinion writing, narrative writing, informational writing, grammar & usage, and production & distribution over time.
Here is a close up of a few sections:

You can download these rubrics for K - 5 on Teacher Sherpa. Click here!


0

Thoughtful Log Entries: Making Thinking Visible


The goal of thoughtful log entries is for students to share thoughtful responses as they reflect upon their reading by using comprehension strategies and text evidence to support their ideas and make their thinking visible. I adapted this idea from the work of Linda Dorn in Teaching for Deep Comprehension: A Reading Workshop Approach ©2005, and I have combined the idea to align with Common Core Standards (RL) Reading Literature and (RI) Reading Informational Text for grades 1st, 2nd, 3rd, and 4th. Originally, these responses to make thinking visible were supposed to be recorded in composition notebooks. The questions were glued on a page and students would write their answers under it. While this is still an option, in 2017, we can also integrate technology to make it even more accessible for all students. Using tools like SeeSaw, Book Creator, Explain Everything, or ShadowPuppetEDU, students can record their thinking with their voice, pictures, and videos. When we give students the opportunity to explain their thinking orally, students who struggle with writing can still make their thinking visible to others in a way they couldn't otherwise. Making thoughtful log entries digital will allow you to assess your students' thinking by taking the writing out of the response. 
I wrote a blog post called Close Reading: Character Traits & Text Evidence Brave Irene. It is a lesson designed around the first thoughtful log entry. It has an example of an answer that was done using Book Creator. 


You can use it as a formative or interim assessment with this kid-friendly rubric. 


This post contains affiliate links for your convenience, for which I do receive commissions if a purchase is made, but at no cost to you.

1